


News
Press releases, news and articles from the AirSuite team
June Newsletter: Is your organisation running at peak efficiency? 🏃
AirSuite sensors are designed to keep people healthy, but also enable you to find cost saving opportunities in today's challenging economic climate.

The AirSuite newsletter is published once every 2-3 months to members of partner organisations.
Want to receive these updates directly to your inbox?
Update your subscription settings
This month I wanted to shift gears and touch on the budgeting realities that many of the organisations we support are facing in today’s challenging economic climate. Many of our partners are being asked to cut costs, re-focus on core business, or re-evaluate their existing projects to ensure they will achieve outcomes aligned with strategy.
At AirSuite, we advocate for equitable outcomes for students, employees and tenants: we believe everyone deserves to be able to live their best lives and do their best work, and that people are worth investing in. Wellbeing of staff and dependants should always be a top priority, but to make these conversations easier, AirSuite sensors are designed to enable you to find cost saving opportunities too — more on that below.
From our experience as a start-up business, we also know that continuously re-evaluating where we’re heading with a strategic lens is critical to our ability to pivot and provide the services that best meet customers’ needs. For large organisations - big ships that take time to steer on to a new course! - it can be well worth adopting that discipline.
Over the last couple of months, my team have similarly refocused our attention on what matters right now to our key stakeholders. We’ve been working to deliver improvements that directly address some of their key needs up-front, on a pathway to adapt those solutions to meet broader customer requirements in the coming months. This partnership has already proven to be extremely effective - thank you to those we’ve been working with if you’re reading! We’re delighted to have several valuable outputs to share with you already, as well as a sneak peek of what’s to come…
Best regards,
Brad and the AirSuite team
Occupancy & Room Utilisation
It’s easier to have conversations around the health and productivity benefits of monitoring indoor environments when you can also demonstrate cost and efficiency benefits. Occupancy detection has been front-of-mind for many customers we’ve spoken to: understanding how frequently a space is used can inform decisions on space management (e.g. scheduling efficiency) and budgeting for maintenance.
Last year we introduced our Smart Occupancy algorithm, which was created using machine learning to determine whether a room was occupied, trained on the data we collected from motion detection sensors trialled in schools several years ago. Since then, we were thrilled to see that the algorithm produced fantastic results for classrooms, but we kept it labelled ‘Beta’ because we found it to be less reliable for detecting occupancy in office and home environments under some conditions.
We’ve now upgraded the Smart Occupancy algorithm to take more factors into account. That means it now does a significantly better job at detecting occupancy for the edge cases we encountered before. In fact, we think our new method is so good that it outperforms real motion detection in some cases, such as if a person is sitting still, or sleeping (when a motion sensor can’t tell that you’re there)!
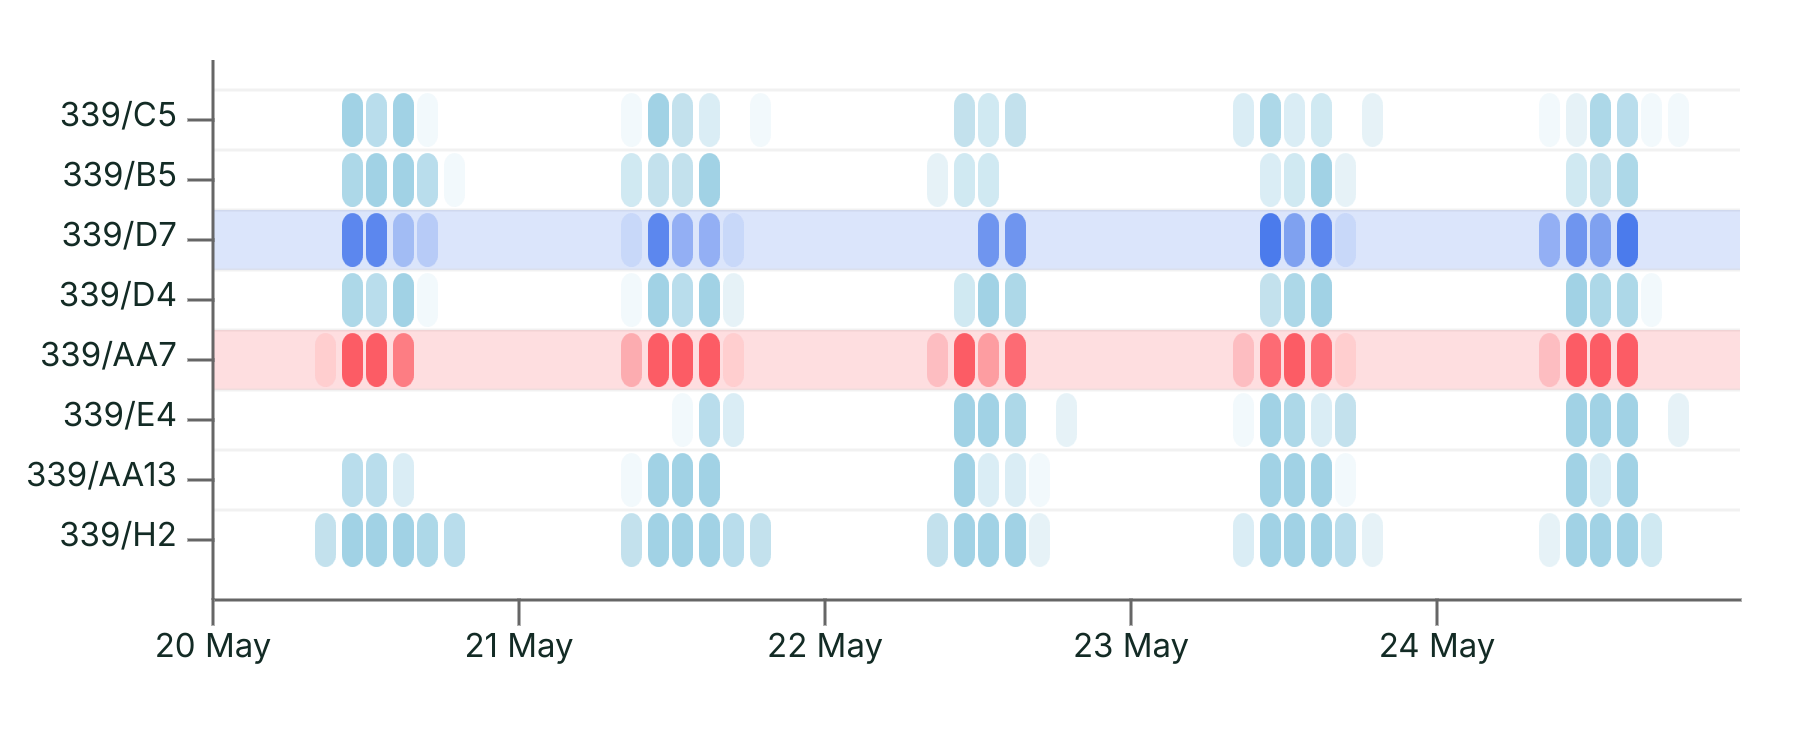
We’ve made the occupancy chart itself more useful too - as shown in the screenshot above, you can now compare occupancy between rooms much more easily with a heatmap-style chart.
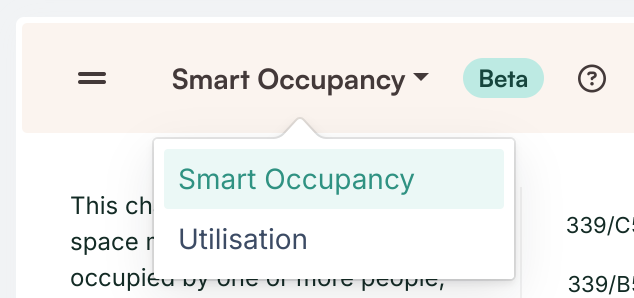
We’ve also been experimenting with other ways to visualise occupancy. One example that we’ve just made available is the Utilisation chart, which can be accessed by clicking on the ‘Smart Occupancy’ chart title, and selecting ‘Utilisation’ from the dropdown.
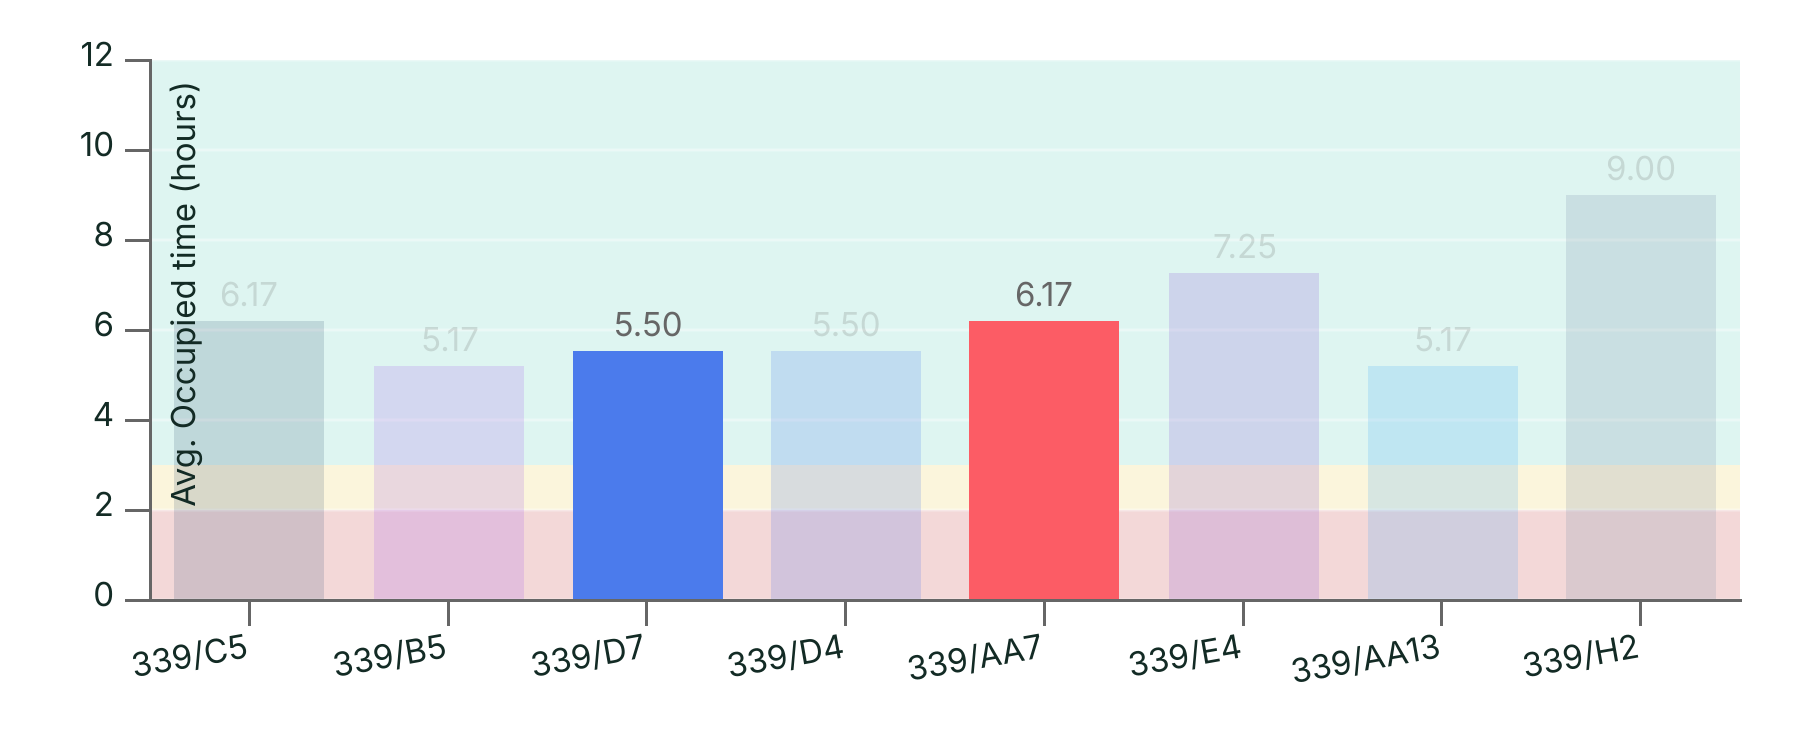
When you’re looking at one sensor, you’ll see the Utilisation graphed as the number of ‘utilised hours’ each day. Then when comparing devices, we’ll show you the average utilisation rate of each device, as in the chart below:
Please let us know what you think of this approach! We have some more ideas in the pipeline, but we’d love your input to decide what comes next.
Managing your organisations just got easier
Logistics and administration - they’re the boring bits of deploying air quality monitoring devices, we know! - and when you’re dealing with a whole lot of sensors, you want this to be as straightforward as possible.
We’ve made some major usability improvements for organising your people and devices into sub-organisations. For example, you can now:
- Sort devices by serial number or deployment name
- Filter/search for devices and organisation members
We’ve also made an Audit Log available, so that you can see the changes that have been made to your organisation settings by different people.
This is another area where we’ve been working closely with key customers to meet their needs. For example, one customer had a need to group their devices into a hierarchy of regional authorities and individual properties, comprising over 500 sub-organisations, so they could assign access at each level. We were able to create a mechanism to do this for them automatically, and to automatically provision devices into the relevant sub-organisations going forward.
Is there anything like this we can automate for your organisation? Let us know.
AirSuite Sense LTE + PM
The optional Particulate Matter add-on sensor is now available for Sense LTE devices, giving you the flexibility to install particulate matter sensors easily in any location. Our first batch of Sense LTE + PM devices was manufactured last month and is shipping now.
If you have Sense LTE devices already, they can be retrofitted with the Particulate Matter add-on sensor if needed. Please get in touch with us to learn more.
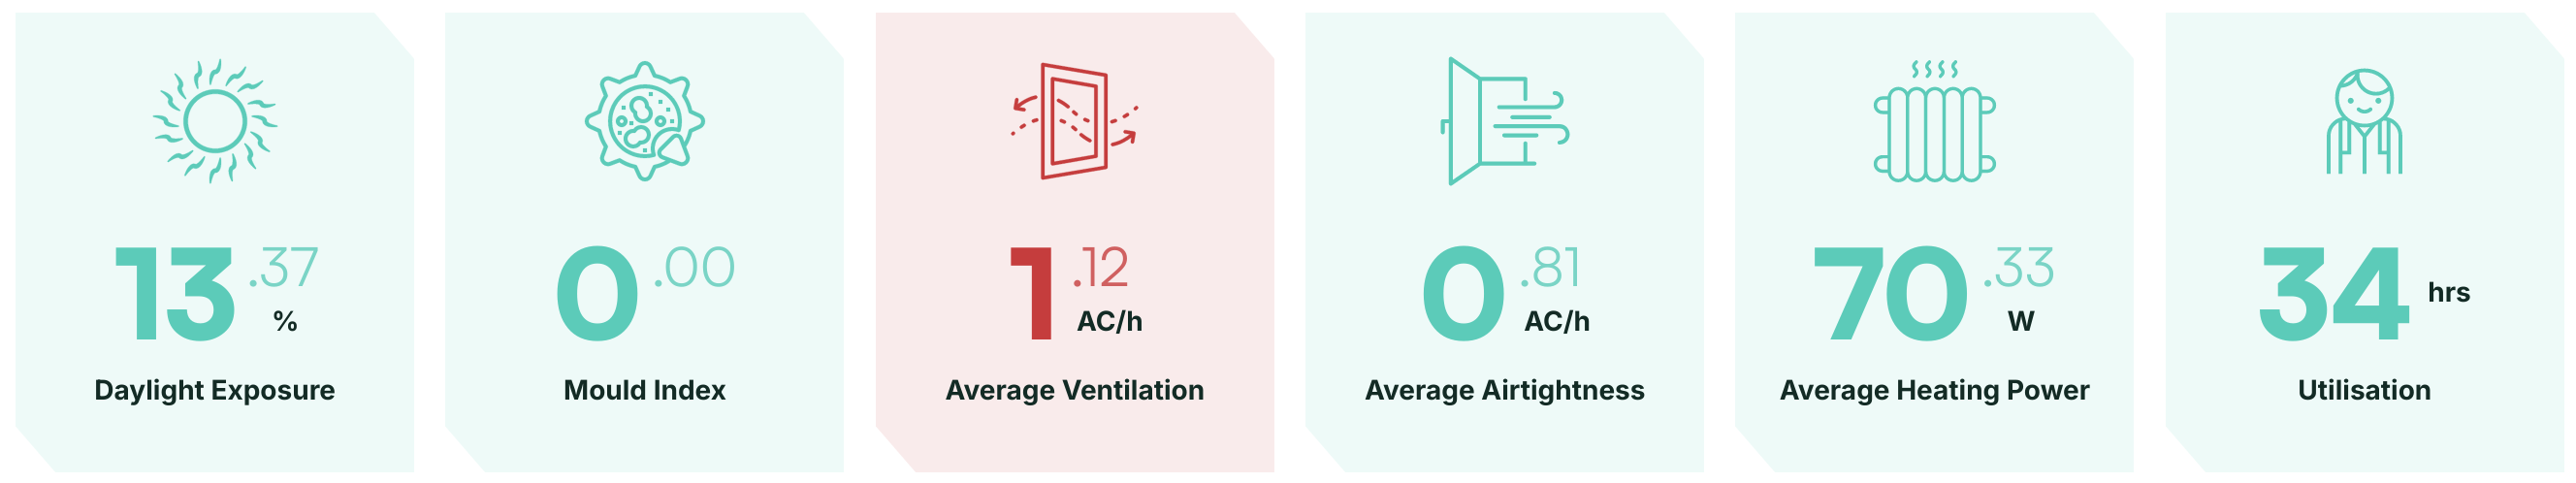
Screenshot of the upcoming Building Performance Insights, being developed in collaboration with the New Zealand Ministry of Education.
Up next
- Data inferences & insights: We’ve been collaborating with the New Zealand Ministry of Education to incorporate various data interpretation methods into the AirSuite Portal. Expect to see metrics for measuring mould growth, ventilation rate, and insulation quality, among others.
- Property management: We’re working on upgrading the Portal to allow you to group, filter, and more easily see insights across properties.
- Making more of the invisible visible: Our next add-on sensors are now in development, which will have the ability to detect carbon monoxide, formaldehyde, and nitrous oxides.
If you have ideas you’d like to see implemented, let us know! We’re always keen to hear your feedback.
Best regards,
Brad and the AirSuite team
2025
2024
- September Newsletter: The Control Room, Rankings, Insights and Alerts 🚨
- Media Release: AirSuite and Jani-King join forces to build wellness in New Zealand businesses
- June Newsletter: Is your organisation running at peak efficiency? 🏃
- April Newsletter: Easter treats from the AirSuite team 🐰
- Nordic cellular connectivity a game-changer for IAQ monitoring
- What's AirSuite doing to keep your data and sensors secure?
2023
Let’s talk about how AirSuite™ can deliver real indoor outcomes for your organisation today